easy read on Kaggle
1
2
3
4
| import numpy as np
import cv2
from scipy import signal
import matplotlib.pyplot as plt
|
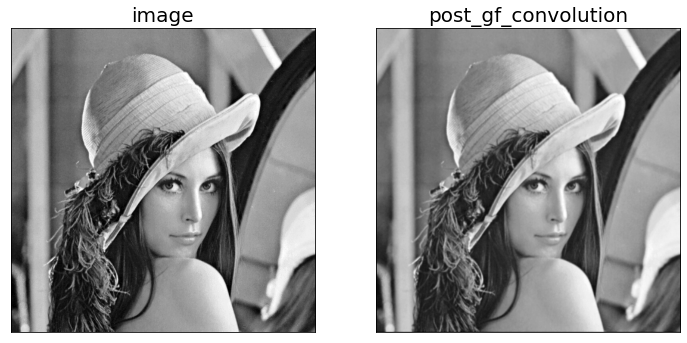
1. Implement a discrete 2D Gaussian filter
using a 3 × 3 kernel with σ ≈ 1/2ln2. Use the provided lena.png as input, and plot the output image in your report. Briefly describe the effect of the filter.
In [2]:
 1
 2
 3
 4
 5
 6
 7
 8
 9
10
11
| def gaussian_kernels(size=3, sigma=1):
upper = size - 1
lower = - int(size / 2)
y, x = np.mgrid[lower:upper, lower:upper]
kernel = (1 / (2 * np.pi * sigma**2 ) ) * np.exp( -(x**2 + y**2) / (2 * sigma**2) )
_# kernel = kernel / kernel.sum()_
return kernel
|
[Python]Gaussian Filter-概念與實作
In [3]:
Out[3]:
array([[0.05854983, 0.09653235, 0.05854983],
[0.09653235, 0.15915494, 0.09653235],
[0.05854983, 0.09653235, 0.05854983]])
In [4]:
 1
 2
 3
 4
 5
 6
 7
 8
 9
10
11
12
13
14
15
16
17
18
19
20
21
22
23
24
25
26
27
28
29
30
| image = cv2.imread('../input/image-filtering-gaussian-filters-lena/Lena.png', cv2.IMREAD_GRAYSCALE)
_# cv2.imshow('image', image)_
print('image:**\n**', image, '**\n**')
post_gf_convolution = signal.convolve2d(
image,
gaussian_kernels( sigma = 1 / ( 2 * np.log(2) ) ),
mode='same', boundary='fill', fillvalue=0
)
_# mode='same', boundary='symm'_
_# mode='same', boundary='fill', fillvalue=0_
post_gf_convolution = np.round(post_gf_convolution)
post_gf_convolution = post_gf_convolution.astype(np.uint8)
_# cv2.imshow('post_gf_convolution', post_gf_convolution)_
print('post_gf_convolution:**\n**', post_gf_convolution, '**\n**')
images = [image, post_gf_convolution]
images_title = ['image', 'post_gf_convolution']
plt.figure(figsize=(12, 6))
for i **in** range(2):
plt.subplot(1, 2, i+1)
plt.imshow(images[i], cmap=plt.get_cmap('gray'))
plt.title(images_title[i], fontsize=20)
plt.xticks([]), plt.yticks([])
_# cv2.waitKey(0)_
_# cv2.destroyAllWindows()
|
_image:
[[168 168 164 … 176 166 141]
[168 168 164 … 176 166 141]
[168 168 164 … 176 166 141]
…
[ 53 53 59 … 115 114 115]
[ 53 53 64 … 118 118 120]
[ 53 53 64 … 118 118 120]]
post_gf_convolution:
[[ 98 125 124 … 130 121 86]
[125 159 158 … 166 155 110]
[125 159 158 … 166 155 110]
…
[ 41 53 56 … 109 109 86]
[ 40 53 57 … 111 112 88]
[ 31 41 45 … 87 88 70]]

2. Consider the image I(x, y) as a function I : R2 → R.
When detecting edges in an image, it is often important to extract information from the derivatives of pixel values. Denote the derivatives as follows:
Ix(x, y) = ∂I/∂x ≈ 1/2(I(x + 1, y) − I(x − 1, y))
Iy(x, y) = ∂I/∂y ≈ 1/2(I(x, y + 1) − I(x, y − 1)).
Implement the 1D convolution kernels kx ∈ R1×3 and ky ∈ R3×1 such that
Ix = kx ∗ I
Iy = ky ∗ I.
Write down your answers of kx and ky. Also, plot the resulting images Ix and Iy using the provided lena.png as input.
In [5]:
1
2
3
4
5
6
7
| kx = np.array([[-0.5, 0, 0.5]])
ky = np.array([
[-0.5],
[0],
[0.5]
])
_# kx.shape, ky.shape_
|
In [6]:
 1
 2
 3
 4
 5
 6
 7
 8
 9
10
11
12
13
14
15
16
17
18
19
20
21
22
23
24
25
26
27
28
| _# cv2.imshow('image', image)_
print('image:**\n**', image, '**\n**')
post_kx_convolution = signal.convolve(image, kx, mode='same')
post_kx_convolution = np.round(post_kx_convolution)
post_kx_convolution = post_kx_convolution.astype(np.uint8)
post_ky_convolution = signal.convolve(image, ky, mode='same')
post_ky_convolution = np.round(post_ky_convolution)
post_ky_convolution = post_ky_convolution.astype(np.uint8)
_# cv2.imshow('post_kx_convolution', post_kx_convolution)_
_# cv2.imshow('post_ky_convolution', post_ky_convolution)_
print('post_kx_convolution:**\n**', post_kx_convolution, '**\n**')
print('post_ky_convolution**\n**', post_ky_convolution, '**\n**')
images = [image, post_kx_convolution, post_ky_convolution]
images_title = ['image', 'post_kx_convolution', 'post_ky_convolution']
plt.figure(figsize=(18, 6))
for i **in** range(3):
plt.subplot(1, 3, i+1)
plt.imshow(images[i], cmap=plt.get_cmap('gray'))
plt.title(images_title[i], fontsize=20)
plt.xticks([]), plt.yticks([])
_# cv2.waitKey(0)_
_# cv2.destroyAllWindows()
|
_image:
[[168 168 164 … 176 166 141]
[168 168 164 … 176 166 141]
[168 168 164 … 176 166 141]
…
[ 53 53 59 … 115 114 115]
[ 53 53 64 … 118 118 120]
[ 53 53 64 … 118 118 120]]
post_kx_convolution:
[[172 2 0 … 6 18 83]
[172 2 0 … 6 18 83]
[172 2 0 … 6 18 83]
…
[230 253 252 … 0 0 57]
[230 250 253 … 254 255 59]
[230 250 253 … 254 255 59]]
post_ky_convolution
[[172 172 174 … 168 173 186]
[ 0 0 0 … 0 0 0]
[ 0 0 0 … 0 0 0]
…
[ 3 3 254 … 254 252 252]
[ 0 0 254 … 254 254 254]
[ 26 26 32 … 59 59 60]]

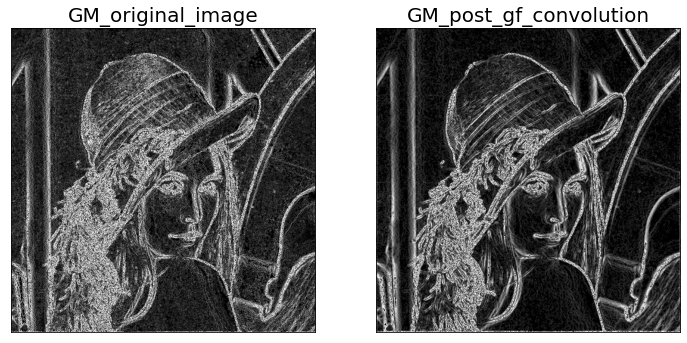
3. Define the gradient magnitude image Im as
Im(x, y) = q(Ix(x, y)2 + Iy(x, y)2).
Use both the provided lena.png and the Gaussian-filtered image you obtained in 1. as input images.
Plot the two output gradient magnitude images in your report. Briefly explain the differences in the results.
In [7]:
 1
 2
 3
 4
 5
 6
 7
 8
 9
10
11
12
13
14
15
16
17
18
19
20
21
22
23
24
| _# gradient_magnitude_original_image_
gradient_magnitude_original_image = (post_kx_convolution**2 + post_ky_convolution**2)**(1/2)
_# gradient_magnitude_post_gf_convolution_
post_kx_convolution_gf = signal.convolve(post_gf_convolution, kx, mode='same')
post_kx_convolution_gf = np.round(post_kx_convolution_gf)
post_kx_convolution_gf = post_kx_convolution_gf.astype(np.uint8)
post_ky_convolution_gf = signal.convolve(post_gf_convolution, ky, mode='same')
post_ky_convolution_gf = np.round(post_ky_convolution_gf)
post_ky_convolution_gf = post_ky_convolution_gf.astype(np.uint8)
gradient_magnitude_post_gf_convolution = (post_kx_convolution_gf**2 + post_ky_convolution_gf**2)**(1/2)
_# plot them out_
images = [gradient_magnitude_original_image, gradient_magnitude_post_gf_convolution]
images_title = ['GM_original_image', 'GM_post_gf_convolution']
plt.figure(figsize=(12, 6))
for i **in** range(2):
plt.subplot(1, 2, i+1)
plt.imshow(images[i], cmap=plt.get_cmap('gray'))
plt.title(images_title[i], fontsize=20)
plt.xticks([]), plt.yticks([])
|

Check me out on Kaggle.


